


We’re all familiar with stats around how many startups don’t hit their annual revenue targets. For example: InsightSquared recently reported that “68% of [B2B] companies miss their forecast by more than 10%” (see here), And HubSpot said that 74% of companies that missed their revenue goals “didn’t know their visitor, lead, MQL, or sales opportunity numbers” (see here). Closely related are the reducing tenures in sales which are now down to 18 months (see here and here).
The causes for missed forecasts and the associated sales attrition are myriad, from bad product-market fit to short-sighted leadership to investors’ over-forecasting (something we’ve blogged about; e.g. see here), and so on. But hardly anyone writes about another major reason, and that has to do with the calculational approaches companies use to forecast, which are literally backwards.
According to Merriam-Webster, the definition of “hindcasting” is that it is a “statistical calculation determining probable past conditions”. Most sales and marketing analytics are doing just that: Analyzing past data to decipher trends that might predict future sales. That does work for larger organizations with clean, complete datasets, but not for disruptive startups (no prior data exists, by definition), turnarounds (the data that does exist is irrelevant now), or simply startups with poor data quality (i.e. analyses are run on a data foundation of sand). Let’s look at typical B2B forecasting to understand the issues.
Typically there are three types of revenue forecasting approaches used that all have their cautions:
- The top-down market size forecast (favored by marketing and fundraising CEOs) is an estimate: Based on guesses about market size, purchase rates, and achievable market shares and penetration rates – you decide how reliable that is. Just because it works in Excel doesn’t mean it’ll happen.
- The problem with bottom-up deal forecasting (favored by heads of sales) is that you need to already have deals that can be forecast. That might work for a mature organization, but again, what about early startups that are trying to get their first few deals? And what about the size of the pipeline upstream from when a prospect even becomes a forecastable opportunity? This method ignores where new prospects will be coming from, yet a major cause for sales reps missing revenue goals is simply not creating enough new pipeline.
- Sales quota capacity models (another fave of sales VPs if they don’t have a deal pipeline yet) are as much guesswork as top-down market size estimates since they rely solely on the belief that new reps will somehow generate a, say, $500K or $1M quota, or higher. Never mind hiring and learning ramps, or innate performance differences where it might take 4 reps to sell $1M in year 1, at a cost of $250K each – i.e. you’re spending a buck to make a buck. Add on marketing expenses, and you might as well be burning your dollars; you’d lose less.
These techniques are not forecasting but hindcasting since they all assume some prior known trend, and they simply extrapolate from past performance. “In the past we’ve had 10 deals and closed 2, so now that we have 18 deals in the pipeline, we’ll close 3 or 4”, or “Claire has sold well over $800K in the past, so we expect her to sell $1M”. That’s called “linear extrapolation” (extrapolating % growth rates will produce a curvy revenue line, but it’s still linear extrapolation using the % growth rates linearly).
That works if you have a steady-state business with large amounts of data to be analyzed. But, as we mentioned above, what about a disruptive startup in a new space where there is no prior data? Or you have data but it’s crappy and can’t be used to extrapolate from? Or what if you’re a turnaround and while you have data, it’s irrelevant? One or more of those three scenarios describe the vast majority of Silicon Valley startups. What that means is that for most B2B startups using much of what goes for analytics for startup and turnaround forecasting borders on being useless.
So, what should the analytically minded B2B startup CEO, CRO or CFO do instead?
Let’s use the analogy of a rocket: For it to hit its target, it’s not looking at where it was and extrapolates that forward. Instead, it’s forward-looking and monitors if it’s closing in on its target, and makes frequent course corrections to counteract a series of small navigational errors. So it regularly measures where it needs to be heading and compares its current position to that goal. It’s not looking at where it was; if it did that, its errors would be compounding, steering it away from the target.
Yet that is how most B2B startup forecasting is still done. Remember, “68% of [B2B] companies miss their forecast by more than 10%”? No wonder. Hence the need for what we call:
Predictive or Adaptive Revenue Growth Planning
Instead of extrapolating from past trajectories, this system works as follows:
- Build a predictive reference model that projects how a company is likely to grow based on leading indicators like activities, inbound lead volumes, click-through rates, etc. That model can be calibrated against whatever data the company has, best practices comparisons, or simply good guesses.
- Create and measure KPIs for each of those leading indicators that need to be met; if not, apply course corrections early (not at the start of the next period when it’s too late)
- As mid- and late-funnel data comes onstream, do frequent plan-actual comparisons, ultimately comparing attained revenue against revenue goals from the reference model
- Once there is enough good data to analyze, we recommend switching to an AI-powered, analytically rigorous system that has high predictive accuracy and can also do long-range forecasting; an excellent system for that is www.funnelcast.com.
- Recalibrate the reference model, and repeat the next prediction cycle
In particular, item no. 2 – the KPIs – is one of the biggest areas of confusion and struggle for small organizations. Typically marketing and sales KPIs do not provide enough of the right detail and so they are often not actionable. They measure a high level set of inputs, but many of those are irrelevant (can you correlate, say, “Twitter Likes” to your revenue? Ever?), or the data is often not nearly granular enough to see which specific marketing channels are working best or worst, which messages are resonating, and which specific sub-market is best.
To illustrate this point, let’s use our rocket analogy again: For it to recalibrate and course correct it must have consistent and detailed data from the right sources. E.g., if we apply typically imprecise KPIs to the rocket analogy, they would be:
- Typical KPIs: Course: Northwest-ish, Location: 1 mile up and 2 miles downrange, plus or minus a few miles either way, Speed: Fast and working hard; vs.
- Actionable KPIs: Course: 274 degrees, Lat 28.13673745, Lon -81.48295924, Elevation 1.14 miles, Speed 3,736 mph
If the “demand gen” rocket was relying on the typical KPIs for a clear course, the odds of hitting its target are much less than 68%.
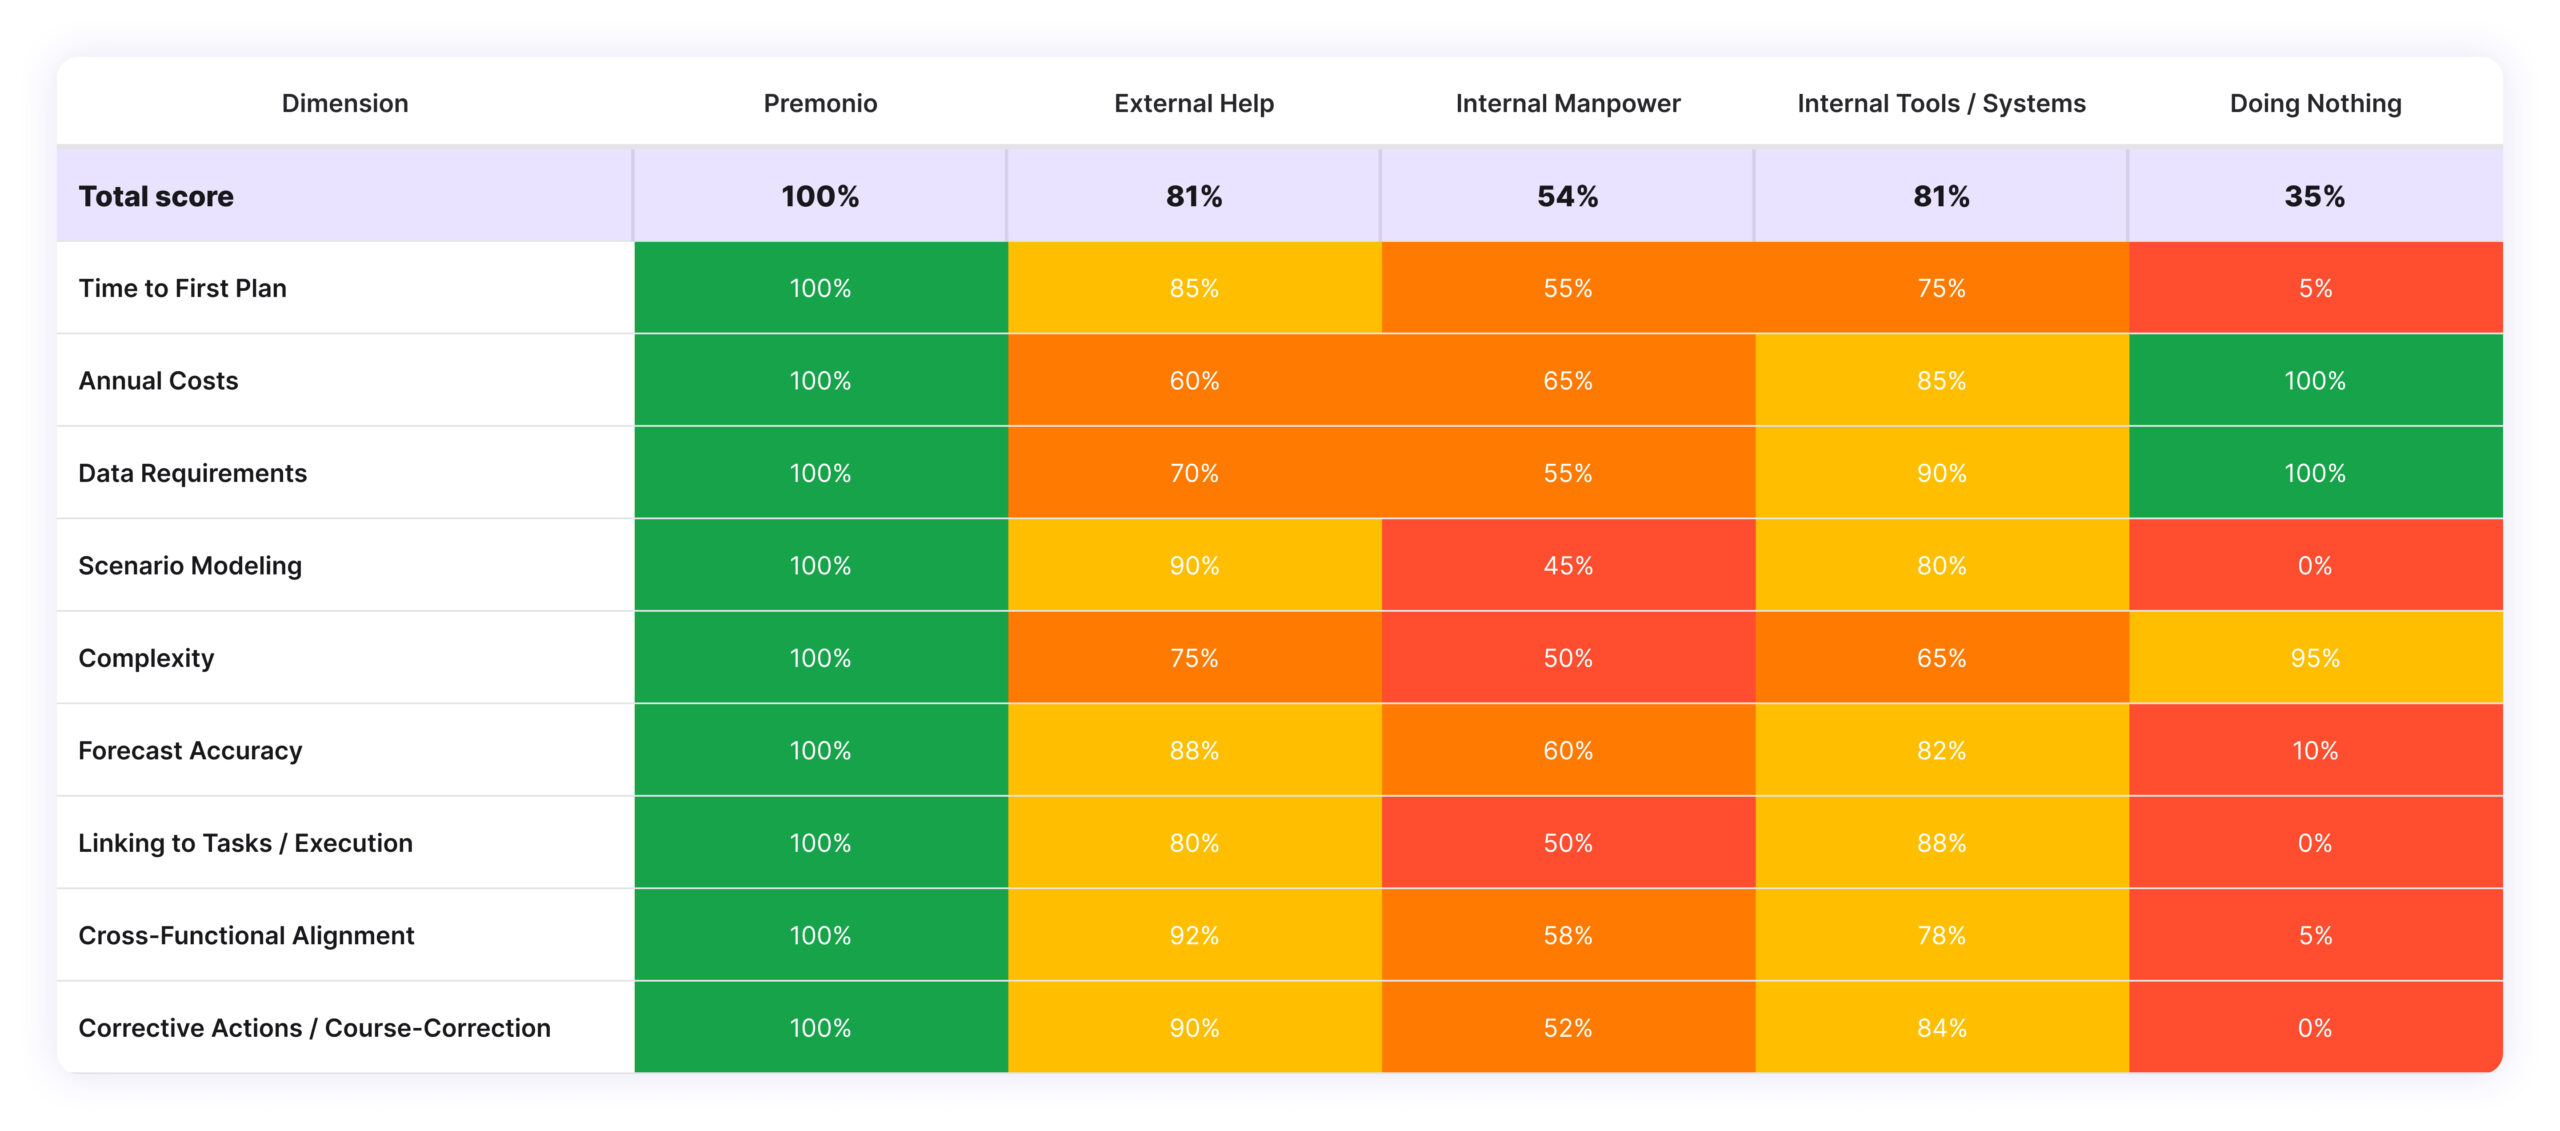
What can you gain from adaptive, predictive planning?
We have taken numerous startups and turnarounds through this forward looking, detailed KPI driven, adaptive planning process, which has resulted in very high forecast hit rates, faster revenue attainment because suboptimal demand generation states are avoided sooner, and also resulted in higher budget efficiency because non-performing lead sources get shut down earlier.
Here is a representative sample of real customer pipeline and revenue data from month 3 and month 5 into a project (it took first 2 months to implement the needed systems and data hygiene):
Figure 1 – Month 3: MQLs overproduced, mid-funnel obstruction, and monthly revenue miss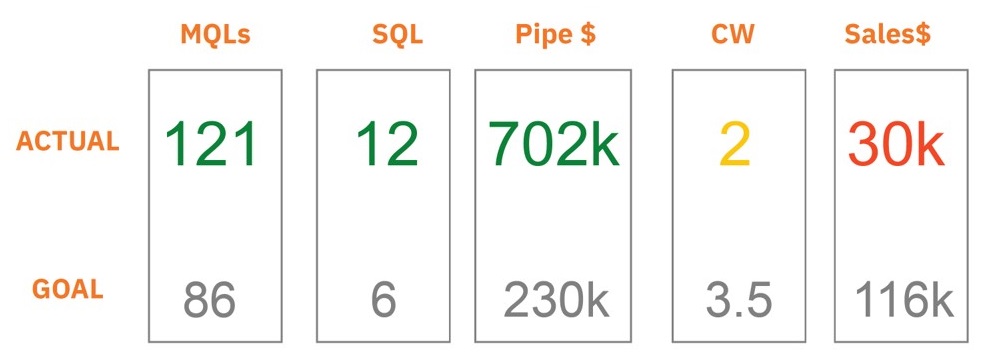 |
Figure 2 – Month 5: MQLs continue to ramp, mid-funnel and monthly revenue are on target 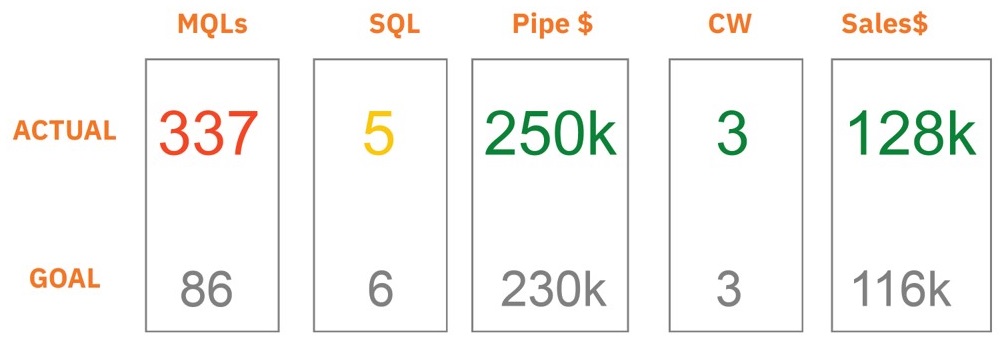 |
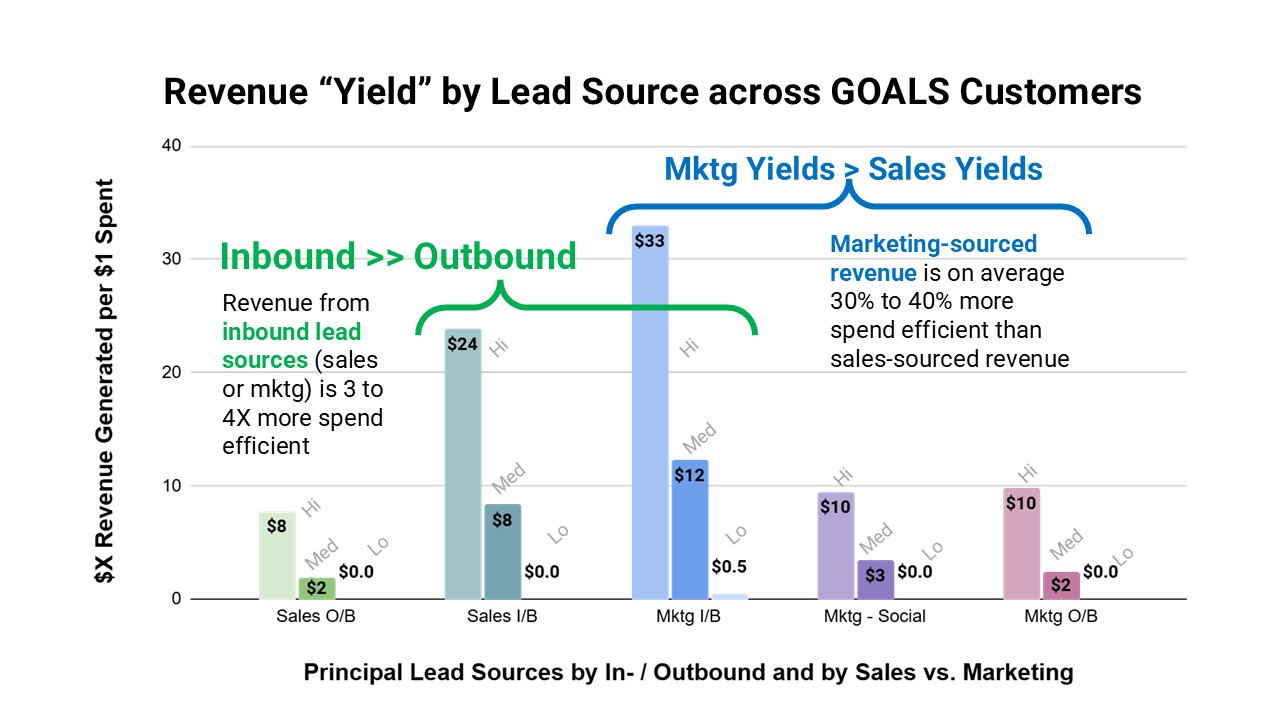
Figure 3 – Outcomes: In the chart below you can see that in a short period of time 1) revenue objectives are being met, 2) there is a better-quality pipeline, 3) there are substantially more and better MQLs, and 4) more and better qualified SQL’s, which lead to more revenue faster!

Another customer is a $80M e-Health cloud company that has now been meeting revenue goals for three quarters in a row, all the while growing marketing-sourced leads despite a 50% budget cut in Q2 of 2022. And similarly, we served five customers through the midst of Covid, and all had to dramatically re-forecast their year in May of 2020 without any prior data to go on: They all hit their 2020 revenue goals, and one even was acquired in Q1 of 2021 on the strength of their predictive revenue management.
If you’re interested in learning more about “Predictive Revenue Growth Planning”, please visit www.premonio.com and chat with us, send us an email, or book a meeting right off the website.