


Over-forecasting is one of the most common — and least discussed — reasons B2B teams miss their revenue number. In a perfect world, your company would hit its projection every quarter. In reality, Small Business Trends reports that 46% of sales reps missed their quotas in 2018 alone. So how do you tell if your team is underperforming, or if someone up the chain is over-forecasting? Small Business Trends reports that in 2018, 46% of sales reps missed their quotas. According to Forbes, the previous year it was even higher, at 57%.
How did we get here? Why have one-year revenue forecasts proved as unreliable as one-week weather forecasts? And what can companies do to be more confident in their ability to hit their numbers?
When a sales team falls short of its quota goal, the common reflex is to assign the blame to the sales reps and their managers. But in our experience, the underlying problem just as often turns out to be overly optimistic, imprecisely formulated revenue growth forecasts.
With this in mind, it’s important for companies experiencing quota shortfalls to consider a fundamental question:
Is your team underperforming, or is someone over-forecasting?
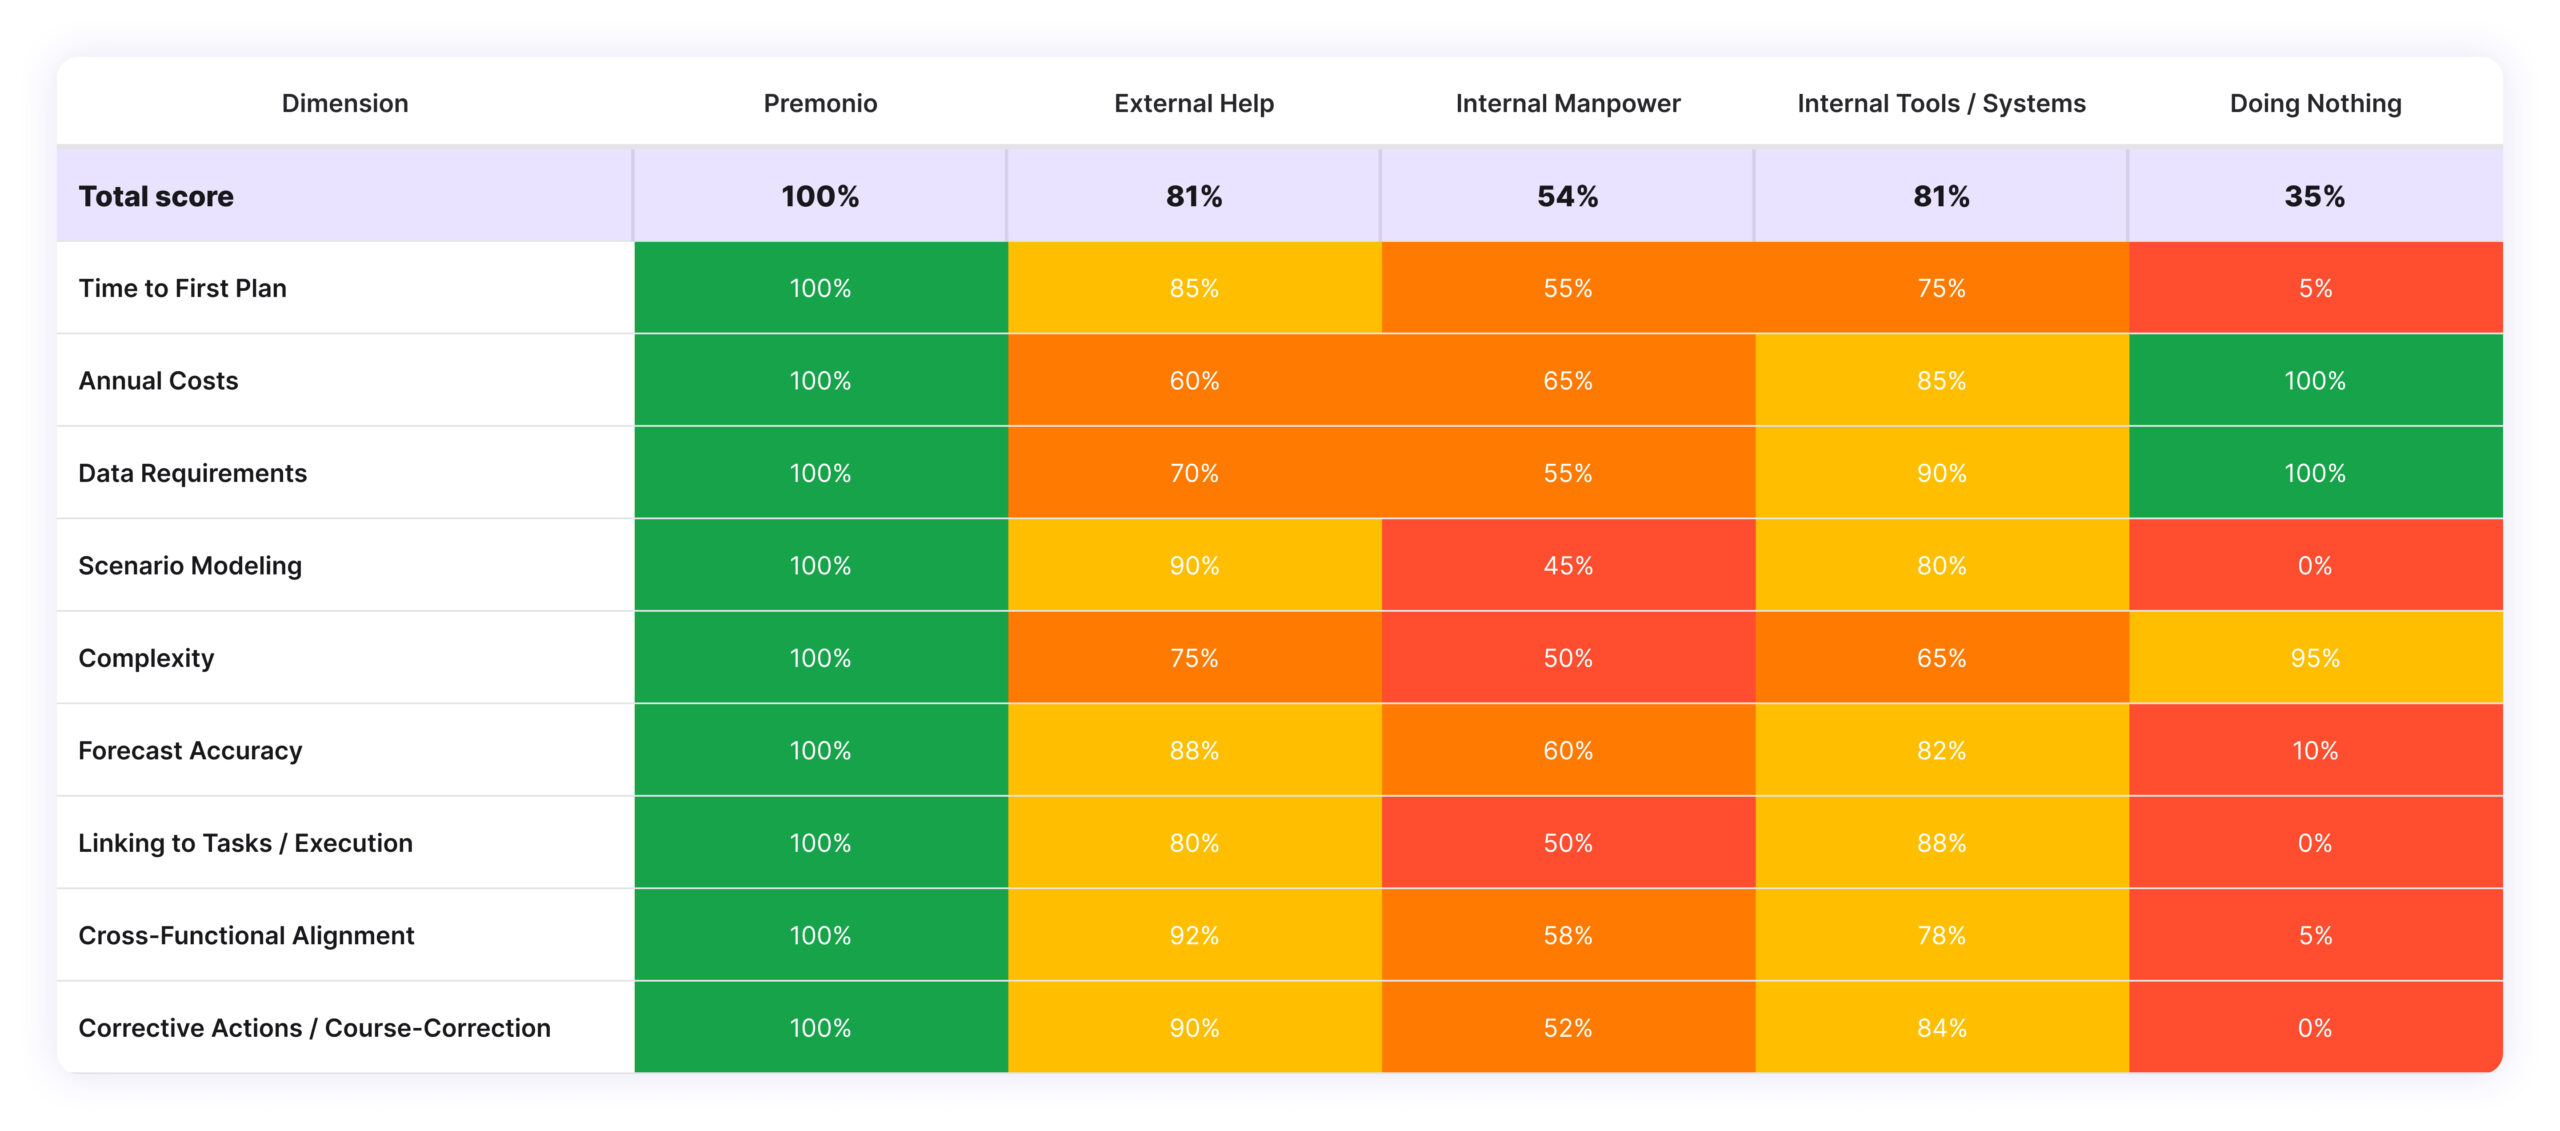
This report will drill down into this question, diagnose some outdated norms that have led to such high rates of quota shortfalls, and show how teams can create a roadmap to consistent alignment between forecasted revenue and actual revenue using a process we call Growth ArchitectingTM. This will empower teams to:
- Improve relations among C-Suite leaders, especially sales and marketing
- Keep the company in good standing with the board
- Validate their growth strategy without spending three or four quarters on trial and error – leading to accelerated time-to-revenue.
Underperforming vs. Over-Forecasting: A Case Study
A good place to start exploring this issue is with a recent case involving an information security software company. When the company’s CEO announced the coming year’s forecast in Q4, the Revenue Operations teams took it at face value. The CRO mapped out a plan, and everyone was off to the races.
The Sales and Marketing teams were able to deliver expected growth numbers quarter after quarter – but they were one quarter delayed compared to the CEOs original Q4 forecast – and by the end of the year, they had fallen short of the CEO’s projection. Instead of rewarding the best quarter-to-quarter revenue growth the company had experienced in its history, despite the one quarter delay, finger-pointing ensued as the board looked for someone upon whom to hang the failure. In this case, that person ended up not the CEO but the Head of Sales. That VP lost their job – only to be replaced by someone far less competent, who led the team head-first into a series of losing years before being let go later, as well. When all was said and done, the company had gone through multiple executives, experienced turnover in the sales and marketing ranks due to a culture that had become unpleasantly political and failed to create any real value for the investors: Seven years later they were sold at a lower valuation than at the time when the CEO had made that original, fateful forecast.
As for the original VP of Sales and other key members of the Sales and Marketing team? They went on to have stellar careers, successfully scaling multiple startups. This suggests quite clearly that the problem isn’t always poor leadership or performance in the Sales and Marketing teams – more often than one might think, it can also be a case of unrealistic forecasting.
Why Forecasts and Actuals Get Disconnected
The case study above begs the question: What if the CEO had been able to see from the outset, using scientific and data-driven insights, that the projection was unrealistic – and understand the changes necessary to make it feasible?
Growth forecasting makes this possible – and it starts with understanding why over-forecasting occurs in the first place. As we survey common practices today, certain aging norms emerge as primary drivers of the problem:
1) Disconnect between decision makers and executors
The revenue figure that the CEO demands typically comes from a board of investors with one goal in mind: to achieve a corporate valuation that will yield large payouts. The growth pattern seen as the best way to achieve this goal might look something like this:
- Year 1: 3X revenue growth
- Year 2: 3X revenue growth
- Year 3: 2X revenue growth
- Year 4: 2X revenue growth
By Year 5, the common idea is to have created enough value to get acquired or go public.
The problem? These edicts delivered from on high are often completely divorced from realities on the ground, where CEOs or CROs, as well as other sales and marketing leaders, struggle to define a path to hitting their board’s revenue projections – or to determine whether such a path even exists with the resources at their disposal. Making these goals feasible requires an interplay between those making the revenue forecast and those responsible for hitting it, whereby leaders on the ground can either:
- Push back: Convey to the board, using data, what revenue attainment is actually feasible given the resources they have.
- Prescribe: Show what resources and practices will be necessary to hit the number that has been assigned.
Without the will or means to pursue a negotiation like this, CROs have little choice but to embrace a revenue goal that they may well lack the means to achieve, thereby setting up their CEO, their team, and themselves for a painful end of the year.
2) Failure to incorporate complexity
If hitting a projection were merely a matter of mapping out the number of leads and the conversion rate necessary for a team to hit their number, it would be easy. Rev-Ops leaders could estimate the number of reps they’d need, the CRO could toss some funding to the Marketing team to expand demand gen activities as needed, and everyone would watch the money come in.
Let’s look at an example of what such a calculation might look like. Say, the CEO forecast closed-won revenue for the year at $15 million – a not-atypical projection for a startup just beginning to stand on its own two feet. If the average deal size expected for the year – based on pricing and historical performance – were $30,000, then the Sales team would need to close 500 deals, either in new bookings or renewals. If we imagine they planned for a lead conversion rate of, say, 1 in 15 (6.7%), the team would need to generate 7,500 leads for the year.
- CEO annual forecast
- $15 million
- Simple calculation
- Average deal size: $30,000
- Bookings needed: 500
- Lead conversion rate: 1 in 15, or 6.7%
- Leads needed: 7,500
In reality, however, things aren’t so simple. To truly understand what it would take to hit $15 million – or if that number is even feasible – the CEO and CRO would have to incorporate a lot more complexity. That simple calculation would be blown up by a plethora of variables, including, but not limited to:
- Conversion rates
A lot happens between “new lead” and “closed-won.” Leads at different stages of the sales cycle convert at different rates. How does the MQL-to-SQL conversion rate compare to SQL-to-SQO? What about SQO-to-closed-won? Conversion rates also vary by lead source, whether they belong to a cold call to an executive, an inbound demo request through the website, or something in between.
- Sales cycle
Selling a small deal to a startup flush with VC cash might take no more than two or three weeks. Selling half a million dollars to a Fortune 500 account, on the other hand, may take months of pitching, proposal writing, technical reviews, wining and dining, and negotiating. Depending on the underlying sales velocity, a deal that’s essential to hitting your revenue goal this year might not actually close until next year.
- Ramp times
If hitting a goal requires hiring new sales reps, accounting for variations in ramp time is paramount. Based on factors like industry experience and seniority, it typically takes between three and six months for a rep to be fully ramped. Hiring a rep today doesn’t necessarily mean their close rate will be tracking with a simple spreadsheet forecast by tomorrow.
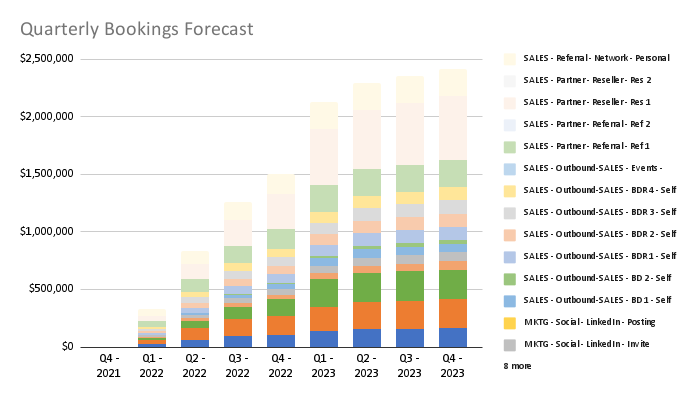
Once all variables are accounted for, what was once a simple calculation might now include a lot of unknowns, and the resulting revenue growth looks something like this:
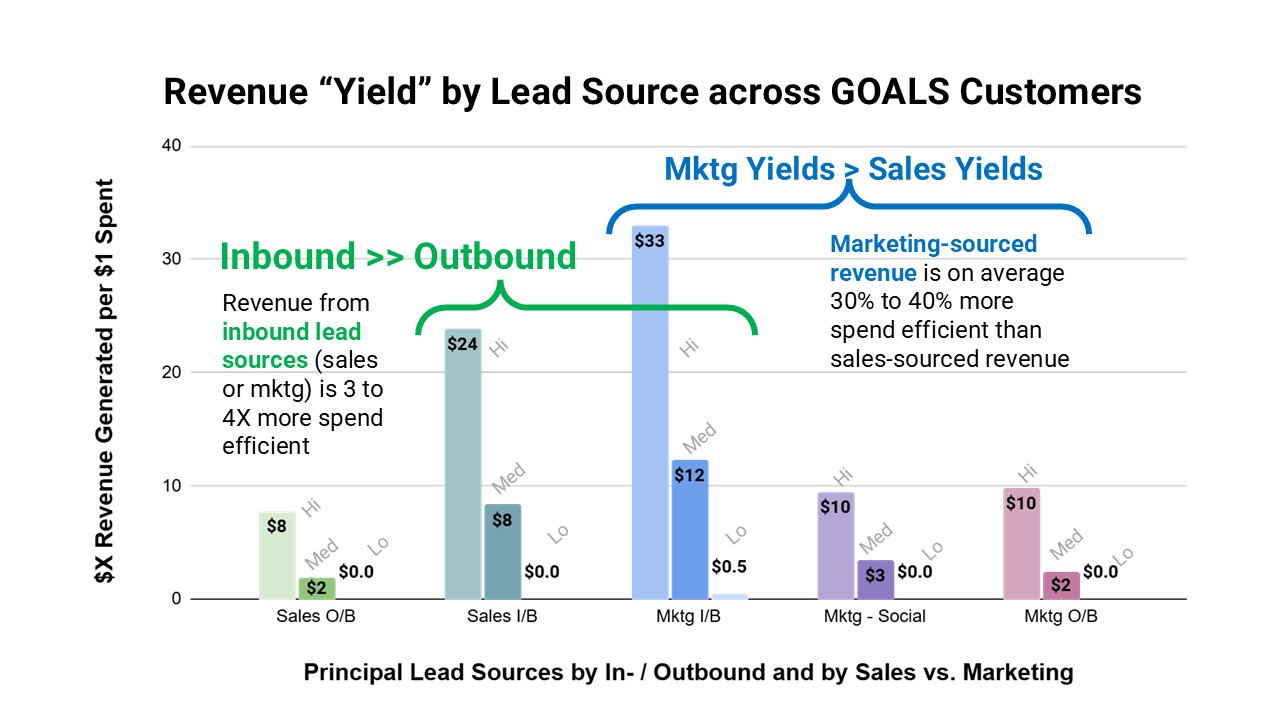
And drilling into first touch revenue contribution by lead source looks something like this:
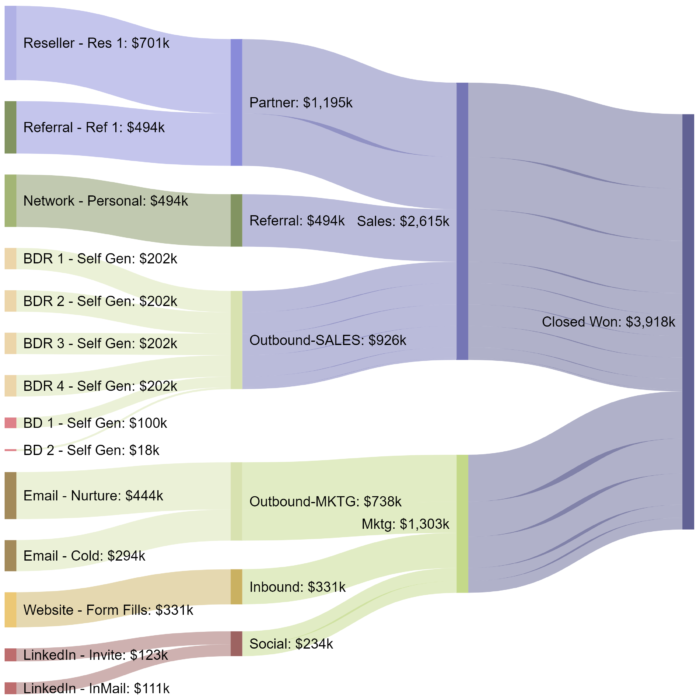
The issue isn’t that CEOs, CROs, and sales leaders aren’t aware of all these factors. It’s that they have neither the time nor the tools or resources to incorporate them into their forecasting model and game plan, leaving them no choice but to rely on simple models – typically using ordinary spreadsheets that aren’t well-equipped or dynamic enough to handle the necessary complexity – and fall short as a result.
How to Use Growth Architecting to Make Things Right
Aligning forecast revenue with actual revenue requires relying on an often incomplete or imperfect body of data. It requires using detailed calculations to either push back against an unfeasible revenue forecast or prescribe the changes necessary to make it feasible. It requires the flexibility to adapt when unexpected challenges emerge along your way to your goal. Growth architecting, at its core, is a methodology that incorporates all these measures.
Here are the key steps to successful growth architecting.
1) Define an integrated, detailed lead flow
As you map out your lead flow, consider the following questions:
- What lead sources will we need to tap to hit our goal, and that can be shown to target the precise segments or ICPs that we want to engage?
- What minimum lead conversion rates will we need to maintain, and how will they differ for each source?
- Given this information, and the resources at our disposal, how many leads will we need each source to deliver?
- What will the average deal size need to be?
- What additional budget and resources will we need to achieve all of this?
If, after answering these questions, the numbers look unfeasible, then either push back on the forecast or use the data to map out the necessary increases in, and reallocation of, resources and budget.
Keep in mind that when it comes to lead sources, there’s often an inverse relationship between volume and conversion rate. For example, an email campaign can pull in a healthy volume of content engagement-based leads – but few if any of them are likely to convert to opportunities; meanwhile, BDR prospecting or inbound web leads may pull in a much lower volume of leads, but at a higher conversion rate.
2) Account for key variables
Certain aspects of your calculations will involve a range rather than a fixed number. To keep forecast revenue aligned with actual revenue, teams need to account for variations in:
- Sales velocities
If your customer profile includes companies of all sizes, you’re likely to see a wide variety of sales velocities. A lead at a small company will probably close after a relatively short sales cycle – pulling in that lead near the end of the quarter or year is probably safe. But if your plan includes enterprise leads, you may need to either increase the volume, or create a mechanism for pulling them in before the end of Q3, to account for a sales cycle that often stretches for months at that level.
- Ramp time
Just as different leads take different lengths of time to convert, some sales reps ramp up more quickly than others. If and when you enter negotiations for more resources, keep in mind that getting new reps onto your payroll does not, by itself, get you to your goal. You have to make sure they’ll be ready to start closing early enough to produce the revenue you need from them.
3) Check in periodically
After you map out, in detail, what it will take to get to the revenue you need, it’s time to switch from planning to monitoring. Check in regularly to see how you’re tracking against your goals and determine what optimizations, if any, you need to make. We suggest starting at bi-weekly or monthly intervals, as this will allow for tidy recaps of the beginning, middle, and end of each quarter.
In some ways, this is nothing new. But while most teams today check in on their progress toward goal during their weekly or monthly syncs, these check-ins are often treated as informational, with little to no talk of optimization when the data reveals a shortfall. And quite often there is no line of sight between raw lead sources – say, search engine ads or BDR cold-calling – and their resulting contributions to closed-won bookings. This needs to change.
Beyond Revenue: The Fallout from Inaccurate Revenue Projections
Everyone has an interest in making sure forecasts and actual revenues line up. The board wants a return on their investment. The CEO, by committing to a number, is laying their reputation on the line, and therefore wants confirmation that that number is achievable. The CRO wants assurance that the available resources and budget are commensurate with the revenue forecast, so they’re not walking into a buzzsaw. The CMO, meanwhile, wants a clear roadmap for bringing in the necessary quantity and quality of leads, so that a miss can’t be pinned on their demand generation engine.
The true tragedy of missed forecasts is that even though all these leaders share the same goal, the reflexive instinct for self-preservation often leads to finger pointing and strained relations instead of a problem-solving attitude. This creates more harm than just lost dollars and cents:
- C-Suite relations can sour
Everyone in the C-Suite needs to be on the same side if the company is to succeed. Infighting will only stymie progress. Unfortunately, that’s exactly what often happens when a company misses its number and finger-pointing ensues.
- Careers can suffer
As the case study with the infosec company makes clear, a missed number and the resulting finger-pointing can have a serious impact not just on the health of the company, but on individual careers. People lose their jobs. What would otherwise be career-long, mutually beneficial professional relationships are strained and broken. Especially with the heads of sales, their careers end up having to take unexpected turns – even though the problem wasn’t them missing their number, but rather that their “number” came from an unrealistic, poorly-architected company financial forecast that didn’t take feasibility into account.
- The optics are unsavory
Just as bad as these events themselves is the fact that all of it is playing out in front of an audience. Leaders bickering as revenue falls short paints a picture of instability and incompetence, causing customers to lose faith – which, of course, further imperils future revenue generation. Never mind the loss of credibility and faith with the employees.
Conclusion
Growth architecting asks a lot of C-Suite leaders. It demands a level of meticulousness and detail in revenue forecasting that busy leaders have historically found impractical. It also demands a culture change, whereby leaders and their teams exchange finger-pointing for problem solving and a stronger sense of shared purpose, even in times of trouble.
This culture change comes from committing to a data-driven approach to pipeline management. In regular intervals – every two to four weeks is a good place to start – all revenue generating teams should convene to review what worked and what didn’t, what achieved the KPI goals and what fell short. It takes people a while to pursue their work this way, both dealing with the potential discomfort of having all one’s numbers out in the open and having to discuss other people’s ideas if their area happens to be the one not hitting KPIs.
But it also provides the tools to either push back on unrealistic forecasts or prescribe the means to make them realistic. Having a truly data-driven pipeline will make leaders more confident – in their revenue projections, in their negotiations with the board, and in the overall success of the company. Then they won’t have to consider whether their Rev-Ops team is underperforming, or the CEO is over-forecasting – because the answer will be neither.