


We’re at the knee of the COVID-19 infection curve in the US with several thousand confirmed; new infections already announced this weekend (the date of this writing is March 15, 2020). Most logistic curve simulations of the virus’ spread suggest a doubling of total infections every 4 to 6 days until containment methods like social distancing and hygiene begin to inhibit the virus’ spread.
Of course, being at that knee is associated with a marked increase in the public’s concern for everyone’s safety compared to a week or two ago. However, there continues to be little in the way of practical and fact-based guidance and information for marketing professionals to come up with concrete measures that probably should be undertaken now.
In last week’s blog (click here), I published a compendium of factual information sources. I suggested a) separating accurate reporting of the current public health crisis from media and political attention, and b) 8 practical planning steps for an organization. Many of those planning assumptions rest on the macroeconomic outlook, which in turn depends on an estimate of how much bigger the epidemic will become – or public perceptions of it as that also drives the economy.
How bad will it get?
In that vein of trying to publish rational, fact-based analysis, in the last section of this blog is my prediction of where we stand right now. It paints a milder picture. My review below suggests that the reproduction number (i.e., the number of new people infected by one infected person) in the US has already dropped from a high of 7 or 8 to now almost 2. If this trend continues, it would suggest we’ll be hitting the inflection point of when the epidemic’s growth will begin to decelerate reasonably soon.
One would thus hope for a moderate economic disruption, but don’t forget the economic effects of sensationalizing and fear. A lot of what companies do now depends on their expectations of how bad the economy will get. Depending on that assessment, companies then need to re-forecast Q2 and the rest of the year accordingly. So, the rest of this blog deals with some practical steps marketing and sales leaders can take to accomplish this re-forecasting quickly, as well as with an illustration of how an analyst could assess the epidemic’s likely ultimate size in the US.
A quick, practical approach to re-forecasting 2020 B2B bookings and pipeline
Here is a step-by-step process:
Marketing – Create a top-down booking and pipeline forecast:
- Take your monthly or quarterly pipeline forecasts for 2020 and make percentage allocations to distribute them into four new, post-COVID-10 buckets:
- % of quarterly bookings with no change, i.e., they stay as is
- % price reduction needed, i.e., how much that portion of the pipeline is reduced
- Reduce closure rates by a %age, either by delaying lead and sales velocities to model later close dates or canceling deals altogether
- Create high, medium, low estimates of the above, estimated % changes
- E.g., segment these four buckets by vertical and grow the forecasts for likely coronavirus gainers (e.g., healthcare, bidets, select tech sectors, etc.) and reduce the ones for losing verticals (e.g., hospitality, some manufacturing, travel, etc.)
- That results in a new, top-down pipeline and bookings forecast for 2020
Sales – Create a matching, bottom-up forecast for at least the next two quarters:
- Estimate which deals are at risk of delay, price reduction, and cancellation
- Create four new columns next to the expected bookings for each deal, i.e., no change, price drop, delay, or cancel
- Enter the deal amount into one of those columns.
- And then add up the new totals for each of the four columns to create a unique, bottom-up forecast.
Compare and align bottom-up with top-down forecasts.
- It is essential to calibrate both approaches against each other because the sales team may have an incentive to forecast low to create a safety cushion. While marketing has an incentive to forecast high to avoid the pressure of having to dramatically ramp up pipeline production to make up for anticipated reductions
- After calibrating the two approaches against each other, it will be useful to make high, medium and low estimates of the resulting, combined forecasts to model different economic outlook assumptions (see above and bottom)
Plan and model compensatory measures to make up for likely forecast reductions:
- Identify sales reps and territories that are most likely going to lose or delay sales and focus lead generation on them.
- Shift marketing spend from events-based lead generation to digital sources (i.e., SEM, social media campaigns, email marketing) and teleselling
- Ramp up content production, and in particular thought leadership content that is not self-serving in this crisis; people remember who helped them when times were tough
Rerun your forecast/revenue model and implement spend shifts
- Model in all anticipated changes described above
- Then layer in the budget shift to/from sales from/to marketing
- And budget shifts within marketing (e.g., from events to digital)
Handoff to the finance department so they can rerun their company cashflow model and growth projections
As already said, the extent to which you’ll use an approach like the one outlined above to modify your forecast down (or up?) will depend on your assessment of the macroeconomic outlook. This, in turn, should be correlated with the extent of the ultimately resulting epidemic.
However, this raises an interesting dilemma: If you listen to some media coverage and watch stock markets plunge, the world economy may well crater, and we should all prepare for a recession. Which would suggest cutting your forecast to the bone (indeed, one of my pro-bono client’s head of sales just proposed a 90% cut; talk about cya). However, with that comes to the inevitable budget cuts or, worse, layoffs. Once those are executed, it will take months to turn the demand generation machine back on.
Now, what if the epidemic will be milder than it’s hyped up to be (as I’m suggesting in the following section based on China’s precedence and some virus propagation modeling)? If your marketing and sales budgets are cut to the bone, you’d be handing market share to your deeper-pocketed competition if they can hit the ground running faster than you can since they didn’t cut back as deeply.
So, the emotional knee-jerk reaction to the coronavirus of cutting way back risks being a massive over-reaction that would cost you market share. On the other hand, if the economy does indeed falter and you didn’t cut back budgets, you’ll risk making painful losses.
How you square that dilemma all depends on what you think the economic impact will be, and in the sea of contradictory, unclear, and sensationalized information, that’s hard to do. Hence, I’m concluding this post with a description of how I created my estimated outlook of the epidemic’s likely course in the US for the next one or two months as a way to calibrate and ground my thinking in all the noise.
The Estimated Epidemic Spread in the US
Please note that I am not an epidemiologist nor otherwise an expert of pandemics, and I am not a trained medical professional, nor am I trying to render an official prediction here. I am, however, illustrating a reasonably straightforward process a trained analyst could go through to form his/her own opinion, which is needed right now. Your management or board will want your advice on where this is all headed because they need to decide how to adjust the 2020 budgets and growth expectations. This blog aims at helping with the formulation of a well-reasoned response that can be replicated. Vs. Simply reacting from the gut or, worse, from a place of fear.
With that said, my estimation of the pandemic in the US suggests that the inferred reproduction rates underlying the daily infection statistics do not paint a doomsday scenario. I had used the same model with the Chinese infection statistics back in January and February, which predicted a stabilizing of their crisis by the end of March. This is indeed what has been happening there since late February.
Now, applying the same model to the current US data (as of March 15, 2020) suggests that the number of additional patients that a new patient infects has dropped from initially almost 8 to now near 2 (this number is called the “reproduction number” or R0; for an explanation refer to this Wikipedia link). Once R0 drops below 1, then more patients exit the infected pool than enter it and the epidemic will begin to die out. Here is the graph of my estimated R0 for the US for the first 15 days in March:
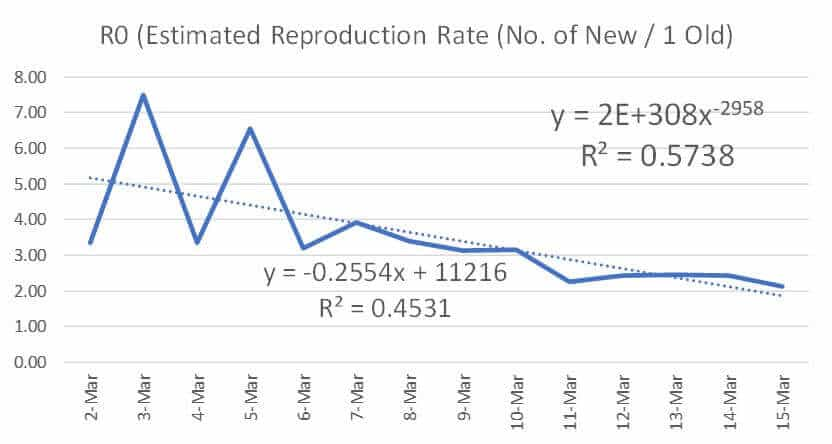
In China, the similarly estimated R0 had dropped below two by the end of January when about 8K to 10K patients were infected, and the epidemic peaked out a month later at 81K infected. I.e., an 8X to 10X multiple compared to the number of infected when R0 had reached 2 for the first time.
Now, assuming that the voluntary quarantining in the US works as well as the government-imposed quarantine worked in China (in either method, the virus runs out of other people to infect), and assuming that similar social contact rates and discipline apply, this would suggest that the US’ total patient count would peak at between 30K and 40K infected (i.e., 8X to 10X over the 3,800 on March 15).
March 27, 2020 Update
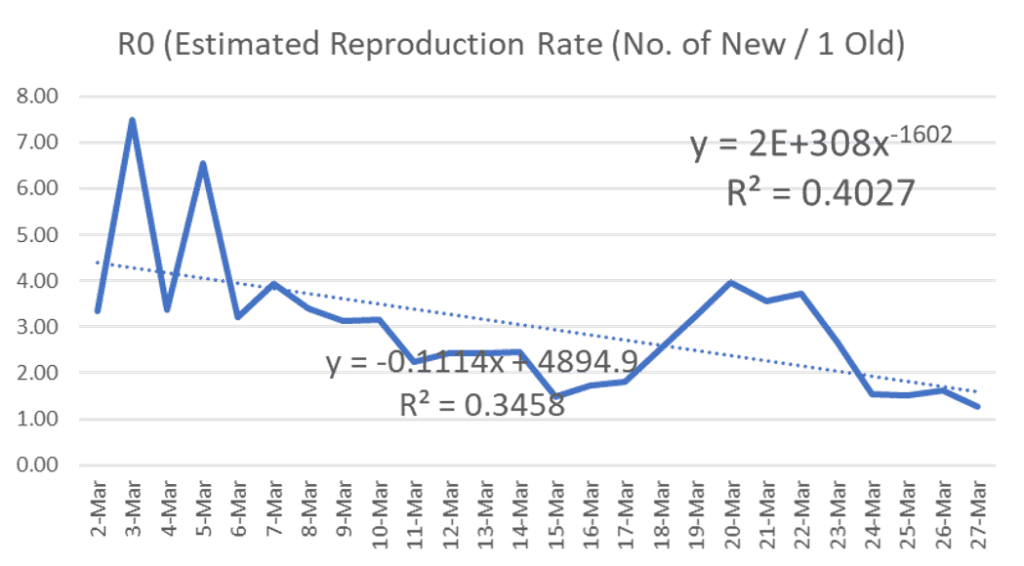
Since we published the above estimate, it has become apparent that the number of undiagnosed cases was much more significant than had been published. With an acceleration of the growth of reported infections having additionally come from wider spread testing, not just the underlying spread of the epidemic. You can see the resulting update to the US’ reproduction rate estimate R0 in the new graphic below.
There is good news and bad news: The good news is that R0 is falling again in the US (of course, subject to the availability of accurate infection data), and is now again around 1.5. Still, an R0 of 1.0 or below needs to be reached for the epidemic’s growth to be reversed. The bad news is that two weeks since the last estimate went by without consistently implementing the needed quarantining measures, and between the higher discovery rate due to wider spread testing now and the lack of social distancing (i.e. continued travel, the Miami beach episode, etc.), the virus continued its course mostly unperturbed.
Thus we now have over 100K infected, and assuming by now infection data is accurate and quarantining measures hold consistently (two big ifs, admittedly), and applying the above 8X multiple again would now suggest that the number of infected people in the US should peak out at around 800,000 people.
In these two weeks, the cost of inaction and indecision is these 760K people increase in the size of the ultimately infected population; that’s unfortunately how epidemics work. Second, it has made a damaging economic impact a self-fulfilling prophecy. Dealing with 40K infected and a roughly 4 to 6-week quarantine would have been one problem, coping with 800K+ infected, unprecedented layoffs, and economic contraction is now another. Funny what a difference two weeks make ?
Here is my most current R0 estimate:
Now, this model’s purpose is to illustrate a simple estimation technique that a marketing forecaster can run to visualize R0, a critical leading indicator that one should watch if one wants to have a sense of where the epidemic is trending. This model is not an official forecast.
However, if you are interested in a serious simulation of the epidemic, a MUST WATCH for anyone seeking to understand how COVID-19 spreads and what to do to minimize its impact is Grant Sanderson’s “3blue1brown” (deserves a huge Shout-Out). He has produced THE most coherent, yet easy to grasp video of how this epidemic grows and how to contain it. It’s 23 well narrated minutes and can be found here (link).
Important Caveats
- As mentioned, this is not an official prediction; it is merely my modeling, which only has predicted well once thus far (China). I am not guaranteeing this outcome, and I instead want to illustrate a rational estimation process a business planner could go through.
- Given the irrationality in the market right now as no one has a good feeling for how big the pandemic will get, the markets’ fears may well make a recession a self-fulfilling prophecy. I can’t model that.
- And, most importantly, this more optimistic picture should not be taken as a suggestion to not self-quarantine; quite the opposite: The only way to keep R0 low enough is precisely for everyone to stay home; probably for about the next four weeks if the Chinese experience is any guide (note that four weeks also is roughly the sum of the incubation period plus the probable outer limit of the time one is sick with coronavirus, i.e. it is the outer limit of the time an infected person can pass on the virus).
- Last, this estimation is only as good as the officially available data. If the hidden number of infections in the US is much higher than what is being reported, the ultimate size of the epidemic would have to be adjusted upward accordingly, but not its principal behavior and timing if the self-quarantining holds.
So, what’s your choice: Hoist more sails, stay your current course, or turn into port?